Entries in Google Analytics (4)

Monday
Oct242011

Getting a "Feedjit Rush" to Schnitzelbahn

As part of the blogging experience, we have used and discussed Google Analytics.  While that is a tool to look at data from past traffic, the more interesting questions is how to proactively increase future readership.

Schnitzelbahn is an income-free hobby for Frau A and I (notice... no ads) so we don't obsess about this.
However, my Mom has a family blog and I noticed a free banner on her page that shows who's been on site.

(You should let that first part sink in a little... my Mom has a blog!  She is so cool.)

The banner showed general info about recent viewers of her blog - notice I'm at the top, "from Munich, Bayern":


I found it ironic that in the second banner (right, above), this company itself had poor formatting (the "e" in "site").  And they are trying to convince me that they can drive traffic to Schnitzelbahn?  Not a good first impression.

Nonetheless, out of curiousity, I clicked the bottom of the above banner to see exactly what the proposition was to "Get visitors to your site" and how they could offer to get us 6 million ad views/clicks for less than 50 bucks:


So the company is called Feedjit.  They offer the banner that my mom has for free -- she gets neat info, and they get free advertising space... to sell ad space.  They also offer more advanced (pay) versions of that banner, plus underlying analytics (probably like Google's) to get detailed info about visits, time per page, click path, etc.


For a "Rush" of visitors, our Schnitzelbahn ad would appear at the bottom or their banner.  More details here:


Well, why not?  So I wrote some quick 4-line copy that markets Schnitzelbahn with "share our adventure".
I mentioned specific things that I thought would stand out or attract more clicks (e.g., beer, BMW, Alps):


So, on 1 September at 17:00, our copy started appearing in the Feedjit banners around the world.
You can refresh the status page at any time to view progress.  After 15 minutes our "ad" had appeared on pages "seen" by over 56,000 people.  That's 3700 "impressions" per minute... it'll take a while to get to 6 million.


After 15 hours active, they reported our "ad" had received access to almost 2.5 million "impressions"...


... then after about 1.5 days they claimed we had received the promised 6 million "impressions" -- from which only 282 people actually decided to click on the banner ad and navigate to Schnitzelbahn.  That is a click rate of 0.005%.


Was that a bad result?  A good one?  Hard to tell.  It was certainly cheap!  The ad was not placed in a focused manner.  It could have (and surely did) appear in any country, on web sites pertaining to any random topic.  The "eyeballs" that we received may or may not have been inclined to or capable of (English!) visiting Schnitzelbahn.


What was really interesting is the info from Google Analytics afterwards.

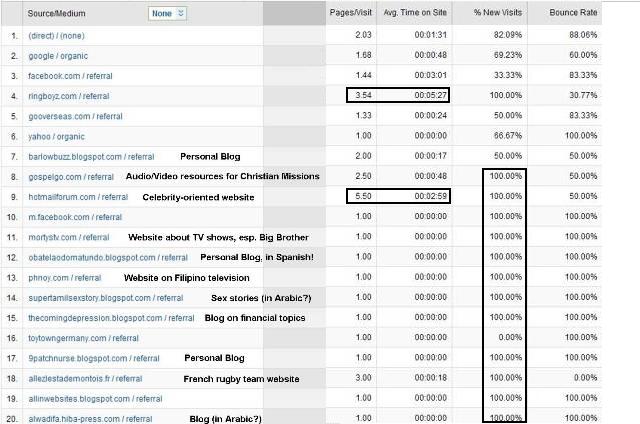
What sites ("referrers") that had the Feedjit banner ad and had people that clicked over to Schnitzelbahn?
Celebrity gossip and TV shows, Christian mission, a French rugby team, and even erotic Arabic stories!  Wow!!!
 

Of the people that visited us those days, readers from China and Taiwan surfed the most and stayed the longest:


This was a fun experiement for $49, but probably did not fundamentally change the Schnitzelbahn readership.
But it's another learning experience.  Any readers have recommendations for other things we should try like this?

Sunday
Aug142011

Google Analytics Part 3 - Trigger Points

In a prior post we shared maps indicating the locations from where people read the Schnitzelbahn blog.  Hello world!

In this last part about Google Analytics we'll share what this tool tells us about how people found Schnitzelbahn, and what they're looking at.  (Commercial sites must analyze this data endlessly!)

Traffic tools tend to identify three general sources of traffic.  "Direct" means that the web surfer typed the URL directly into his/her browser.  "Referring" or "Referred" means that they followed a link to Schnitzelbahn from another site.  Finally, "Search Engines" indicate a pass-through from Google, Bing, etc.  Here is our breakdown to date:

At the beginning, most traffic was Direct -- friends and family knew about our little project and simply typed www.schnitzelbahn.com.  Then we started using Facebook statuses (nope, statii is not the plural of 'status', FYI) to let friends know new pages were available, so Referrals increased.  Now, we're continuing to see increase in Referrals (from other web sites outside Facebook) but also an increase in Search Engine-generated traffic.

As with the visitor maps, you can deep-dive to see more information.  For example (see below), Facebook Referrals have a lower Bounce Rate (bounce: reads one page and then leaves) and stay longer.  No surprise here -- what nice friends we have!  People typing the URL directly bounce more and leave more quickly... perhaps because they visit more often and have already seen the older posts?

Referrals from another expat-in-Germany blog (amiexpat.com) are great.  These visitors don't bounce and stay a while.  Thanks Christina!  (Makes sense - both sites talk about life as an American in Germany, so a reader of one probably has some interest in the other.)  There are other insights here as well.

In the referrals, there are tons of Google sites in the list above:  USA, Germany, UK, Bulgaria, Hungary, Czech, Italy, Sweden, India... but what exactly did everyone type into Google to find Schnitzelbahn?  Here's a snapshot of the last couple months.

I highlighted the searches that included "schnitzelbahn".  They're positive, because people are searching for us semi-directly... but they're also not as "organic" as a blind search (blind = they found us purely because of Google says we have valuable content about a specific topic).  Again using the visit data, we can infer a few things.  First, people liked (or at least spent time on) the English Garden and Schlager posts.  They spent more time on site, and these posts inspired them to look at other pages too (low Bounce Rate).

It was neat to see that Google is sending us new visitors on completely organic searches to -- for example, the ones outlined in blue, from "street painting" to "german pranks".  The hits often resulted in 1-and-done visits, but we're not an encyclopedia on these topics by design so that's OK.

Of course Google searches themselves (like Facebook data) are both a source of academic research and cultural indicators.  Google has a hot trends page showing the currently most popular searches.  Google also created a zeitgeist page (zeitgeist is German, meaning "spirit of the times"), showing "how the world searched" in 2010.

For me, the Google searches give insight into how people perceive Germany, and what their personal interests are here.  For example:

"texas like bavaria"                                                      (discussed in our post here)
"deutschland yodeling"                                                (German stereotype)
"German sense of humor"                                            (another stereotype, discussed in our post here)
"where to get a decent hamburger in Munich"      (questions like this are common... need to be a future post obviously)
"German facial hair"                                                     (yet another stereotype, but partially true per our post here)
"weissbier pope"                                                              (you'd be surprised, the Pope and beer are linked!)
"wearing Uggs in Germany"                                      (What the heck???)

There are some, ummmm, other searches that Google connects somehow to Schnitzelbahn.  Not sure if I should say "sorry Mom" in advance, or hope she just doesn't read this far:

"naked on Sylt"                  (nude sunbathing is common here, and Sylt is a popular island)
"bahn bunnies"                  (oh my!)
"wiese nude sunbathing"   (nude sunbathing is also common in Munich's English Garden)
"xxl german frau"               (oh my, oh my!!)


Back to more professional themes -  I went through all searches in the last couple weeks and grouped some by topic.  (Google Analytics can't to this.)  It was interesting to see the terms that showed up most frequently:

25 - Munich hiking day trips
17 - photography, Olympus, dramatic tone art filter
14 - alter ego names
12 - Franziskaner, naturtrub
11 - compact camera
10 - chocolate, easter, kinder chocolate
  9 - nutella
  8 - asparagus, spargel
  7 - David Hasselhoff
  6 - gummi bears
  5 - german beards
  4 - beer (this used to be one of the top search topcs... we need to post more about beer again!)

I like to look at these at a higher, more aggregate level:

49 - food
28 - photography
25 - travel
12 - German culture

These are the general themes that Google is matching to Schnitzelbahn, and basically how the blog/site header describes our hobby's intent.  Everything is right with the world!

In fact, Google is also ranking our photographs higher too.  At least in my search results, this Porsche photo is #25 for "dramatic tone art filter", this creation of Frau A is #4 for "gummi art", this Marienplatz photo is #2 for "Munich figures", and bizzarely our map here is #1 for "Kufstein sledding".  (Readers:  out of curiousity... what do your search results return?)

Lastly, Google Analytics can show Entry/Exit pages for visits.  This is interesting because it identifies where people started, and to where they eventually exited on the blog.  For example (below), of the most recent visits to the "How to Build an Igloo" post, a number of visitors then looked at the Time Lapse Photography post before leaving the site.  I can't explain this - not sure what they have in common!  But interesting, no?

We can see how large, commercial (revenue-generating) web sites rely on tools like Google Analytics to improve "performance".  For us, it was simply interesting to see what is out there and learn about it.  Hope you found it interesting too.

Friday
Aug052011

Google Analytics Part 2 - Where in the World?

In the first post on Google Analytics for Schnitzelbahn we looked at data and charts about pages per visit (and Bounce Rate), duration per visit, plus technical information about visitors' computers.

But it's much more fun to see the locations from which people are visiting us!

Coming from the Dashboard you can go to a world map showing visits by country.  You can change the view (boxed in the lower left) to sub-continent/region or even just continent.  (The "dimension" list on the bottom right lets you filter the map.  For example, you could show only visits of people using Macintish computers, or those who stayed longer than 5 minutes.).  92 countries - fascinating!

The map has a little bit of interaction to it -- if you hold the mouse over a country, it flashes the visitor count (within the timeframe you have selected).  I pasted a few over the graphic.  Nothing from Greenland in this view, but a couple from Ecuador & Pakistan, plus solo visitors from Uganda and Mongolia.  Thanks!  (or, better yet, "weebale" and "bayarlalaa")

A pie chart format gives a better indication of what nationalities are reading Schnitzelbahn.  Germany is #1 and together with the U.S. accounts for over 3/4ths of the visits.  Not surprising.  I found Brazil (#6) and India (#10) interesting though.  (Note:  the good-sized gray area is "unknown" location - some users block this info.)

It gets more fascinating when you dig deeper and look at Pages per Visit and Average Time on Site for the countries' visits.  Think there might be a cultural difference between U.S./U.K. and the European Continent?  Check out the Average Time on Site.  Perhaps it has also to due with native English viewers vs. those with English as a secondary language (reading a bit slower, like us reading German).  But some of that gap has to be due to faster/slower lifestyles, right?  Further down the list, it appears that our friends in Turkey, the Philippines, and Denmark actually hang out and read the posts - thanks!  (2+ minutes per visit)

Further down the list (not seen above) are some intersting findings.  The dozens of Hong Kong visitors have looked at over 4 pages per visit on average.  (Most of the 92 countries measure 1.5 or less)  Dozens more readers from Iceland, Algeria, and Syria read more than 2 pages per visit.  Plus, we've had a grand total of 1 visitor from Panama but he/she looked at 16 different posts!

Going back to the global map, let's change to a city view.  Europe and the U.S. are very crowded, but this perspective points to some interesting cities in South America (Santiago-Chile, Pelotas-Brazil), the Middle East (Beirut-Lebanon, Tel Aviv-Israel), Eastern Europe (Tbilisi-Georgia, Kiev-Ukraine), and Asia (Shibuya-Japan, Cebu-Philippines).  I've been only to Tel Aviv, but would love to visit all of them and post some photos "on site"!

If we "click" on the U.S., it can also show a gradient map by state...

... but in Europe it goes right to the city view.  Here is Germany (I overlayed some of the major cities, if it wasn't obvious):

Once again, we can drive down to a list of cities ordered by number of visits (either globally, or within a specific country).  This is the global view below.   Munich sits #1, with German cities taking the top 4 spots (cool!).  A couple of cities appeared surprising at first, but after investigation showed that they are the U.S. locations, not the originals!

It's just enjoyable to see random visitors from all over the world.  Beer and lederhosen lovers are everywhere!  Thanks for stopping by...

We have one more post coming on Google Analytics, that will look at how you (the viewers) got here, and what you looked at.


Thursday
Jul282011

Google Analytics Part 1 - Visits and Visitors

The first post on Schnitzelbahn was published about 10 months ago, and after 280 blog entries (so far) we've been keen to learn more about the visitors and traffic here (and about the tools that "real" webmasters use to give them such info).

In other words:  enough about us, let's talk about YOU.

We use Squarespace, which provides the blogging software and site hosting.  Squarespace does collect some traffic information, but we wanted to check out tools that major sites would use.  Specifically, this post is about Google Analytics.  Please note:  Schnitzelbahn has no advertisements and does not generate any revenue -- this is just a hobby... an exercise in learning for us.  We're not spying on you!

Here is our home page for Google Analytics, showing the dashboard for Schnitzelbahn - some figures are scrubbed, but the gist is there.  The top section is a line chart showing number of visits by day.  You can change this to cover any time period you want (boxed in the upper right).  Underneath are sections that allow deep dives into the data.

In the screen capture above I've outlined a few areas that we'll "click on" to see details.  The first area is called "Site Usage" and has a few key statistics:  Pages per Visit, Average Time on Site, Bounce Rate, and % New Visits.

Here is what Pages per Visit looks like (below).  Obviously, you want visitors to look at more than one page when they stop by - it means your content is interesting to them.  One quarter of our readers view 2-4 pages per visit - not too bad?  (we have no reference)

Next is Duration of Visit.  Again, it's common sense that the longer the better.  You can't see it here, but most of the 0-10 second visits are the result of a detailed Google search -- I guess that the surfers here were looking for something specific and determined quickly that we didn't have the info he/she was looking for (e.g., product specifications, specific tourist info, etc.).  Overall, 13% of visitors stay 2 minutes or longer. 

Things get more interesting when you look at duration of visit by day -- and map this to the specific content.  You can see which posts kept people reading... obviously lots of people stuck around to view the Eurovision videos on May 10!  (It's a little tricky because of the time difference for readers -- late surfers in the U.S. might view content "the next day" here in Germany... but overall you get the picture.)

Bounce Rate was new to me - it's just the percentage of people that view one page and then leave (see the pageviews table above).  Again, viewing this data by day shows you what content got the viewer to read additional pages.  If we're honest, though, we also have to admit that day-of-the-week has a lot to do with surfing behavior.  See how low the Bounce Rate is on Sunday and Monday?  (Sunday - just feel like relaxed surfing & reading.... Monday - will do anything as a diversion from work!)

Let's go back to the Dashboard and "click" on Visitors Overview, to get pretty specific data on the computer(s) you're using to read Schnitzelbahn.  For example, Google Analytics will show the distribution of browers used.  Firefox beats IE by a whisker.

If we "click" on Firefox, it will even show us a distribution of the Firefox versions used!  (There are similar charts for versions of Flash player.)

We also can see operating systems of the viewers' computers (love the 1.5% Linux!)...

... and even the screen resolution of your monitors.

The most surprising, to me, was that Google Analytics "knows" what Internet/network service provider was used to connect.  I love that fact that visitors from Siemens have such long Average Time on Site -- glad to give you a distraction guys!  The folks using Sonic are in and out in a flash (less than 13 seconds) and don't stick around (91% Bounce Rate).  Wonder why?

No, we can't steal your credit card info, and haven't planted hidden video cameras in your house.  It was just interesting for us to get a glimpse of a tool and some data/charts that "real" web sites night use.  (Google Analytics is free.)

You can see how information about the user's computer (OS, browser, screen resolution, etc.) would be helpful in making decisions about how to design a site.  We keep things pretty simple so it's not as valuable to us, but there's probably a lot more that goes on in commercial Web site planning than most people realize.

In the second part coming next week we'll look at where you, the viewers, are located throughout the world.